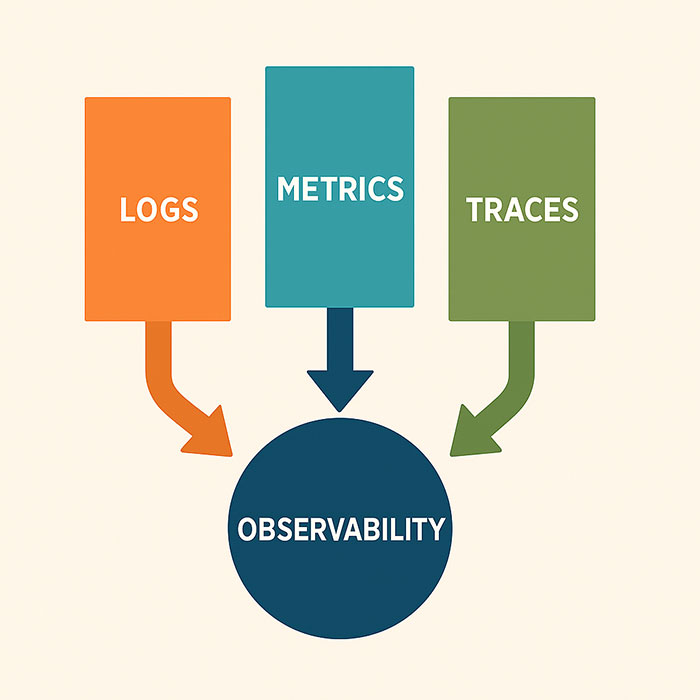
For decades, monitoring has been the backbone of system reliability. Its alerts signal that something is wrong, but they rarely explain why. Observability goes further by combining logs, metrics, and traces to provide context. It’s like upgrading from a basic smoke detector to a diagnostic system that pinpoints which component is overheating—and what triggered it. Modern platforms often generate the required data; the challenge lies in integrating it into a unified, searchable system that accelerates incident resolution and reduces late‐night alerts.
Breaking Down Data Silos
Data fragmentation is one of the biggest hurdles to effective observability. Application logs may reside in an ELK stack, metrics in a time‐series database, and traces in a proprietary tool. Swapping between interfaces—and wrestling with inconsistent timestamps—delays root‐cause analysis.
Adopting a unified observability platform or integrating tools via open standards like OpenTelemetry makes it possible to query logs, metrics, and traces with a single language. This consolidated view enables questions such as “Which deployment introduced the latency spike?” to be answered quickly. Connected data also reveals patterns—such as region‑specific configuration issues—before they trigger customer‑facing outages.
Integrating AIOps for Smarter Alerting
Alert fatigue remains a persistent problem. Hundreds of low‑priority warnings can drown out critical issues. AIOps applies machine learning to prioritize alerts based on historical trends, current context, and business impact.
For example, a small CPU increase on a development instance at 3 AM may be insignificant, while the same spike on a production cluster at noon requires immediate attention. An AIOps engine can suppress harmless alerts and escalate the critical ones directly into a run‑book. Over time, alert noise decreases, allowing teams to concentrate on issues that truly matter.
Building an Observability‑Driven Culture
Tools alone won’t guarantee success—cultural adoption is just as important. Key practices include:
-
Shift‑left instrumentation: Integrate observability into CI/CD pipelines so new code ships with built‑in tracing and metrics.
-
Blameless post‑mortems: Conduct reviews that identify observability gaps and track action items for continuous improvement.
-
Shared dashboards: Ensure developers and operations engineers use the same views, fostering collaboration rather than siloed workflows.
A shared data language removes barriers and transforms reliability from a reactive firefight to a collaborative mission.
Turning Telemetry into Continuous Improvement
After collecting telemetry, consolidating data, and applying AIOps, the next step is a continuous feedback loop. Start by defining a meaningful service‐level indicator (SLI) for a critical service, establish a realistic service‐level objective (SLO), and measure progress against it. Celebrate milestones—such as reducing mean time to recovery by half—and then select the next service to optimize.
By treating observability as an ongoing process rather than a one‑time implementation, IT teams can transition from simply keeping systems alive to driving measurable business value—and that makes all the difference.


